
The 2026 Q2 Data Shows a Smaller House Workforce
The House begins the second half of 2026 with materially fewer permanent Member-office staff than it had at the beginning of the last decade.
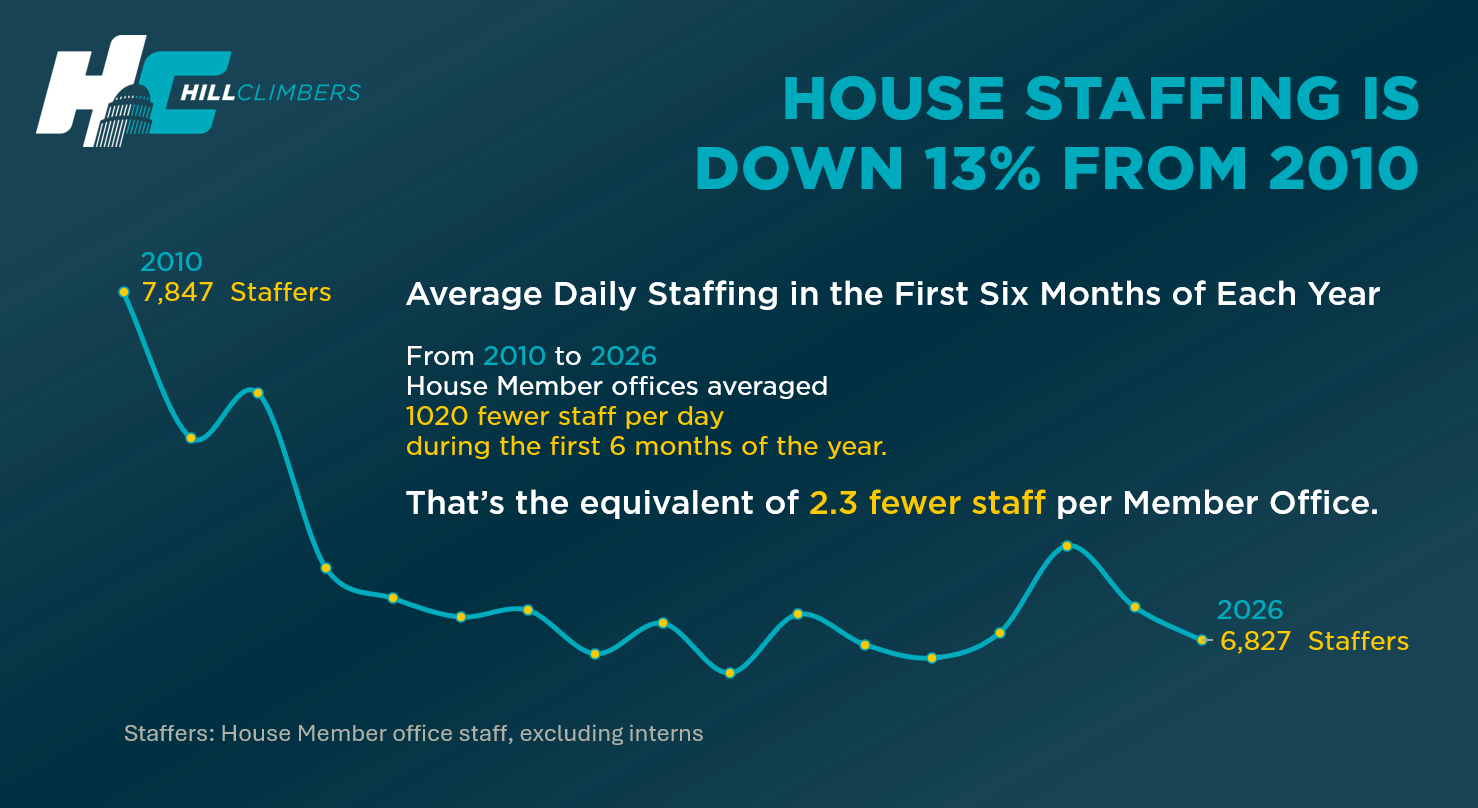
New HillClimbers Q2 data shows House Member offices averaged 6,827 staff per day excluding interns during the first half of Legislative Year 2026.
In 2010, the comparable average was 7,847.
That is a difference of 1,020 staff per day, or 13.0%.
Spread across today's 441 Member offices, that is equivalent to about 2.3 fewer staff per office.
The House enters the second half of 2026 with about 1,020 fewer daily Member-office staff than it had in the first half of 2010.
That does not mean every congressional office has lost exactly two or three positions. Offices vary substantially in size and structure, and Members make different decisions about how to use their budgets.
But institution-wide, the difference represents a meaningful reduction in staffing capacity.
House Staffing Is Down 13% From 2010
A Member office is not just a Member. It is a team responsible for legislative work, constituent services, district operations, communications, scheduling, administration and casework.
Readers unfamiliar with the underlying House staffing model can see HillClimbers' explainer on the 18+4 staffing framework, Member Representational Allowance and typical office structure. How Congressional Staffing Works
Congressional capacity is staff capacity.
And there is less permanent Member-office staffing capacity than there was in 2010.
The Long-Term Decline Has Not Been a Straight Line
House staffing did not simply fall 13% in one continuous decline.
The first-half averages show several distinct periods:
The sharpest long-term contraction came during the early 2010s.
Staffing then spent much of the late 2010s and early 2020s clustered below 7,000 before expanding again after Congress increased office resources.
HillClimbers previously traced that budget-sensitive pattern in Congressional Staffing Levels Rise Or Fall Based On How Much Congress Invests In Itself. Staffing expanded after congressional funding increases and began retreating again as office budgets flattened. Congressional Staffing Levels Rise Or Fall Based On How Much Congress Invests In Itself
A related analysis of congressional office size found the same broad pattern at the office level: teams contracted under budget pressure, expanded after funding relief and then faced renewed pressure as that growth stopped. How Big Is a Congressional Office Team and Why It's Shrinking Again
The Q2 data adds another checkpoint to that story.
The 2024 Staffing Rebound Did Not Last
The recent peak came in 2024.
House Member offices averaged 7,065 non-intern staff per day during the first half of that year.
That was the highest first-half staffing level since 2013.
But the recovery reversed quickly.
Average staffing fell to:
- 6,926 in 2025
- 6,827 in 2026
That is a decline of approximately 238 average daily staff from 2024 to 2026, or 3.4%.
This matters because HillClimbers' earlier 2026 analysis had already identified weakening staffing during the opening months of the year.
In Flat Budgets Don't Mean Flat Staffing Levels, HillClimbers found that staffing excluding interns fell from February through March 2026 faster than the average decline seen across recent second sessions of Congress. Flat Budgets Don't Mean Flat Staffing Levels
Q2 shows that the weakness was not confined to a short February-to-March window.
The average for the entire first half is lower too.
The House rebuilt some staffing capacity after the post-2021 funding increases. It is losing some of that capacity again.
The Budget Squeeze Is Showing Up Beyond Headcount
Staffing is only one place the pressure is visible.
HillClimbers' analysis of 2026 Q1 House Member office spending found average office spending fell 11.5% from the prior Q1. Personnel spending declined 3.3%, while non-personnel spending fell about 30.3%. House Offices Are Running Out of Things to Cut
That is important because Member offices operate from a constrained MRA.
An office can shift money among payroll, travel, rent, supplies and other needs, but flexibility does not create new resources.
If an office protects salaries, it may have to cut elsewhere.
If operating costs rise, staffing may absorb part of the pressure.
And if offices cannot sustain both headcount and competitive compensation, remaining staff may carry more responsibility.
The latest HillClimbers analysis of multiple-role staffing shows exactly that kind of structural pressure. The share of Member-office staff with more than one classified role reached a new high in 2026. More House Staff Are Wearing Multiple Hats
That matters to this article for another reason too.
It is why HillClimbers changed how All House Staff is calculated.
Why HillClimbers Recalculated All House Staff
Congressional staffing data can answer two very different questions.
The first is:
How many people perform a particular role?
The second is:
How many people are actually in the workforce?
Those are not the same calculation.
Consider an employee whose title is Deputy Chief of Staff and Communications Director.
For role analysis, that staffer legitimately belongs in both categories.
If someone wants to know the salaries of Communications Directors, the employee should be included.
If someone wants to know how many Deputy Chiefs of Staff are working in the House, the employee should be included there too.
HillClimbers' Member Office Roles data is designed to preserve those real combinations rather than forcing every staffer into a single artificial job category. Explore Member Office Roles
But if the question becomes:
How many people work in House Member offices?
that same staffer cannot become two people.
Earlier House-wide calculations could carry role-expanded observations into aggregate metrics. As multiple-role staffing grew, that increasingly risked overstating the size of the workforce.
HillClimbers has now rebuilt its All House Staff calculations so the aggregate view counts people rather than role appearances.
A person with two roles is still one person when the question is how many people are in the House workforce.
This is an office-view, person-level calculation.
For House-wide staffing, a staffer with two classified roles counts once.
For individual-role analysis, the same staffer continues to count in both roles.
The methodology now matches the question being asked.
What Changed, and What Did Not
This recalculation does not mean HillClimbers' individual-role analysis was wrong.
Quite the opposite.
A person who actually serves as both Legislative Director and Deputy Chief of Staff belongs in both role populations when analyzing those jobs.
The change applies when HillClimbers rolls role observations into institution-wide measures such as:
- All House Staff average daily staffing
- All House Staff excluding interns
- total staff employed
- House-wide turnover
- House-wide multiple-role shares
- House-wide compensation
Those metrics should describe people.
Role metrics should describe roles.
The revised distinction is now reflected in HillClimbers' public All House Staff excluding interns data page, where readers can explore staffing, turnover, multiple-role staffing, shared staffing and compensation together. Explore All House Staff Excluding Interns
HillClimbers' underlying congressional workforce dataset is built from millions of official House disbursement records linked across staff identities, roles, offices and time. Explore the Congressional Staffing Dataset
That longitudinal identity matching is what makes the person-level aggregate possible.
We Rebuilt the Historical Series Too
The methodology was not applied only to 2026.
Doing that would make the newest number incomparable with earlier years.
Instead, HillClimbers rebuilt the historical first-half series from 2010 through 2026 using the same aggregate approach.
There is also an important calendar detail.
HillClimbers organizes House payroll records by Legislative Year. January 1 and January 2 are assigned to the preceding Legislative Year.
For this Q2 staffing comparison, the window is therefore:
January 3 through June 30.
That means the denominator is:
- 179 days in most years
- 180 days in leap years
Using the actual number of days matters.
When the historical data is recalculated this way, the central finding is remarkably stable.
The old estimate showed House staffing down about 13%.
The revised person-level series also shows House staffing down 13.0%.
The endpoints are now:
2010: 7,847 average daily staff
2026: 6,827 average daily staff
The difference is:
1,020 staff.
The methodology changed the count. It did not change the story: House staffing is still down 13% from 2010.
Why Excluding Interns Matters
This graph deliberately excludes paid interns.
That does not mean interns are unimportant.
In fact, HillClimbers has documented the opposite.
Paid interns have become an increasingly significant part of House workforce capacity, and their staffing cycle has become much less seasonal.
The special report When Interns Become Infrastructure documented the growing operational role of interns as permanent entry-level staffing contracted. When Interns Become Infrastructure
The newer 2026 spring internship analysis found the spring intern cohort had already reached a record in HillClimbers' daily House data, reinforcing the shift toward year-round internship staffing. Spring Interns Are No Longer the Warm-Up Act
And HillClimbers has separately found that permanent entry-level positions are shrinking while internships take on a larger place in office staffing. How Congress Quietly Replaced Part of Its Entry-Level Workforce
That is precisely why the distinction matters.
An all-staff measure that includes a growing intern population answers a useful question about total office capacity.
But it does not answer the same question as:
How many permanent staff are carrying the ongoing work of Member offices?
For that question, the no-intern view is more useful.
House-Wide Compensation Is Person-Level Now Too
The Q2 update also gave HillClimbers an opportunity to standardize All House Staff compensation around the same person-level principle.
This calculation is more complicated than simply averaging payroll rows.
A single employee may:
- change roles during the year
- receive different salary rates during different periods
- hold multiple classified roles
- receive bonus or overtime compensation
- move between organizations
- appear in several payroll records
A House-wide compensation average should still represent one employee as one person.
HillClimbers now calculates aggregate compensation at the person level before averaging across the workforce.
For All House Staff excluding interns, the 2026 Q2 figures are:
- Average annual compensation: $82,275
- Average annual salary: $82,006
- Average annual bonus/overtime: $268
The calculation is limited to non-shared Member-office employment, excludes paid-intern employment periods, combines eligible salary periods for the same employee, and adds bonus/overtime compensation once per person.
That is also why the broad salary number should not be confused with role-specific salary benchmarks.
HillClimbers previously showed how dramatically the answer to "What does the average House staffer make?" changes depending on whether paid interns are included. The Average House Staff Salary Jumps Nearly $10,000 Without Interns
The same principle applies here.
Who is in the denominator matters.
Some Earlier House-Wide Numbers Will Change
There is a consequence to improving the methodology.
Some earlier HillClimbers Insights contain House-wide aggregate staffing or compensation figures calculated before the person-level methodology was fully standardized.
Those figures are being reviewed.
The articles most likely to need updates are those that answer institution-wide questions such as:
How many House staff are there?
or:
What does the average House staffer earn?
Role-specific findings do not automatically change.
Neither do articles whose central finding is based on the relative movement of an individual role or team.
For example, HillClimbers' team salary work shows substantial differences among legislative, communications, district, administrative and constituent-services staff. Those are role and team comparisons rather than simple institution-wide headcounts.
But earlier articles that used an All House Staff benchmark may eventually display revised aggregate figures.
That includes some 2025 and early-2026 salary analysis.
The earlier article Flat Budgets in 2026 Are Hitting House Staffers Even Harder, for example, used the prior House-wide compensation methodology. Its broader budget-pressure analysis remains relevant, but the aggregate compensation benchmarks should be read in light of the revised person-level calculation introduced here. Flat Budgets in 2026 Are Hitting House Staffers Even Harder
The goal of this review is straightforward.
We are not going to preserve an old number simply because HillClimbers published it before.
We are going to use the best calculation we can build from the underlying data.
The New 2026 Workforce Snapshot
The revised All House Staff excluding interns view now gives us a more consistent picture of the permanent Member-office workforce at the Q2 checkpoint.
For Legislative Year 2026 through June 30:
Average daily staff: 6,827
Total distinct staff employed: 7,654
Staff with multiple roles: 8.7%
Staff shared among offices: 3.9%
Staff turnover: 12.1%
Average House experience: 4.3 years
Average annual compensation: $82,275
Average annual salary: $82,006
Average annual bonus/overtime: $268
Each of those metrics answers a different question.
Average daily staff measures the workforce available on a typical day.
Total staff employed measures the number of distinct people who worked during the period.
Turnover captures how much movement occurred around that daily workforce.
Multiple-role staffing shows how often offices combine functions inside individual jobs.
House experience provides a window into institutional knowledge.
Compensation shows what offices are paying the permanent workforce they are trying to recruit and retain.
Taken together, those measures provide a fuller picture of congressional capacity than raw headcount alone.
Fewer Staff Can Mean More Work Per Person
The House's responsibilities did not decline by 13% because staffing did.
Constituent casework still has to be handled.
Legislation still has to be researched and drafted.
Hearings still require preparation.
Members still need district operations, communications, scheduling, administrative support and constituent outreach.
When permanent staffing contracts, offices have several choices.
They can leave positions vacant.
They can rely more heavily on interns or temporary staff.
They can reorganize teams.
They can combine responsibilities.
Or they can ask the remaining staff to absorb more work.
HillClimbers' data increasingly shows pieces of all of those responses.
Interns are becoming more structurally important.
Multiple-role staffing is rising.
Office staffing expanded when budgets increased and weakened as budgets flattened.
And the latest Q2 data shows the House once again moving farther away from the staffing capacity it briefly regained in 2024.
That is why the 13% decline matters.
It is not just a historical headcount fact.
It is a measure of how much human capacity Congress has available to do its work.
Q2 Is a Checkpoint, Not the Final 2026 Result
The 6,827 figure is not the final 2026 staffing average.
It is the Q2 checkpoint covering Legislative Year 2026 from January 3 through June 30.
Hiring, departures, elections, retirements, office transitions and normal workforce cycles can all change staffing during the second half of the year.
The final 2026 picture will not be complete until the full Legislative Year is available.
But six months is enough to tell us something meaningful.
The House's 2024 staffing rebound has not continued.
Average permanent Member-office staffing has fallen for two consecutive first-half comparisons.
And compared with 2010, the House is still operating with roughly 1,020 fewer daily staff.
Congressional capacity is staff capacity.
The 2026 Q2 data shows that capacity remains substantially below where it began this series.
FAQ
How many House Member office staff are there in 2026?
At the 2026 Q2 checkpoint, House Member offices averaged 6,827 staff per day excluding paid interns. HillClimbers also counted 7,654 distinct non-intern staff employed during the period. The first figure measures the average workforce available on a typical day. The second measures all distinct people who worked during the period.
Readers can explore the full House-wide workforce metrics on the All House Staff excluding interns page. All House Staff Excluding Interns
How much has House staffing declined since 2010?
Average daily House Member office staffing excluding interns declined from 7,847 in 2010 to 6,827 in 2026, a decrease of 1,020 staff or 13.0%.
How many fewer staff does each House office have compared with 2010?
Dividing the institution-wide difference of 1,020 by today's 441 Member offices produces the equivalent of approximately 2.3 fewer staff per office.
That is an institution-wide comparison, not a claim that every individual office lost exactly 2.3 positions.
Why does HillClimbers exclude interns from this staffing graph?
Interns are an increasingly important part of total office capacity, but they are temporary and follow different staffing patterns from the permanent workforce.
The no-intern view gives a cleaner measure of the staff carrying ongoing legislative, district, communications, administrative and constituent-service responsibilities.
For the broader internship story, see HillClimbers' analysis of how intern staffing increasingly remains elevated throughout the year. Congressional Intern Staffing No Longer Ends After Summer
How does HillClimbers count employees with multiple roles?
For an individual-role analysis, a staffer can count in every role the employee actually performs.
For House-wide workforce measures, that employee counts once.
This prevents staffers with two classified roles from artificially increasing the number of people in the overall House workforce.
Why did some HillClimbers All House Staff numbers change?
HillClimbers refined its aggregate methodology so House-wide calculations count people rather than role appearances.
Earlier aggregate calculations could carry multiple role observations for the same employee into an institution-wide measure. The revised approach uses a person-level aggregate when the question concerns the size, turnover or compensation of the overall workforce.
Did the new methodology change the 13% staffing decline?
No.
After rebuilding the historical 2010 through 2026 series with the revised methodology and the correct Legislative Year day counts, House Member office staffing excluding interns is still down 13.0% from 2010.
What is the difference between average daily staff and total staff employed?
Average daily staff measures how many staff were working on a typical day during the period.
Total staff employed counts every distinct person who worked at some point during the period.
In 2026 Q2, those figures were 6,827 average daily staff and 7,654 distinct staff employed, excluding interns.
What is the average House staff compensation in 2026?
For All House Staff excluding interns, average annual compensation at the 2026 Q2 checkpoint is $82,275.
Average annual salary is $82,006, while average recorded bonus/overtime is $268.
These figures use HillClimbers' revised person-level House-wide methodology.
Where does HillClimbers' congressional staffing data come from?
HillClimbers builds its workforce data from official House Statements of Disbursements and reconstructs staff identities, roles, compensation, office movement and longitudinal workforce history. More detail is available on the Congressional Staffing Dataset page. Congressional Staffing Dataset
Is 6,827 the final 2026 House staffing number?
No.
It is the 2026 Q2 checkpoint, covering January 3 through June 30 under HillClimbers' Legislative Year methodology.
The full-year result may change as offices hire, lose and reorganize staff during the second half of 2026.
Suggested Reading
- More House Staff Are Wearing Multiple Hats
- Flat Budgets Don't Mean Flat Staffing Levels
- House Offices Are Running Out of Things to Cut
- How Big Is a Congressional Office Team and Why It's Shrinking Again
- When Interns Become Infrastructure
- Spring Interns Are No Longer the Warm-Up Act
- The Average House Staff Salary Jumps Nearly $10,000 Without Interns
Explore Related HillClimbers Tools
- All House Staff Excluding Interns
- How Congressional Staffing Works
- Member Office Roles
- Congressional Staffing Dataset
- HillClimbers Index
- Congressional Jobs
- Browse All HillClimbers Insights