
2026 Midyear House Staff Pay and Workforce Capacity Report

Five Salary Stories Turned Into a Workforce Story
This report began with a straightforward question:
How does pay differ across the five major teams inside a House Member office?
The five-part series gave us an answer.
Legislative staff led non-leader pay at $75,444.
District staff had the highest full-team average at $85,148, but averaged $70,514 below the District Director level.
The communications team has grown substantially over time, but staff below its functional leader averaged $66,772.
Constituent services staff averaged $65,198 below the director level even though the average CSR/Caseworker brings 4.4 years of House experience.
And administrative staff finished the series at the bottom, averaging $64,114 below the Director of Operations level.
But salary was only part of what emerged.
Once pay is combined with staffing levels, experience, turnover, multiple-role staffing, and longer-term workforce trends, each team tells a different story.
And all five are operating inside the same Member office.
The House does not have one staffing problem. Different parts of the same Member office are absorbing different kinds of workforce pressure.
The 2026 House Workforce Starts With Less Capacity
House Member offices averaged 6,827 non-intern staff per day through June 30, 2026.
In the comparable first half of 2010, they averaged 7,847.
Our Q2 analysis of the long-term House staffing decline found that this represents 1,020 fewer staff per day, or a 13.0% decline.
The House recently rebuilt some of that capacity.
Average daily non-intern staffing reached 7,065 in 2024.
Then the rebound reversed.
Staffing fell to 6,926 in 2025 and 6,827 in 2026.
That leaves the House 238 average daily staff below the 2024 rebound, a decline of 3.4%.
The Q2 update on the renewed staffing decline showed that the weakness identified earlier in 2026 was no longer just an early-year dip.
The House Is Operating With 1,020 Fewer Non-Intern Staff Than in 2010
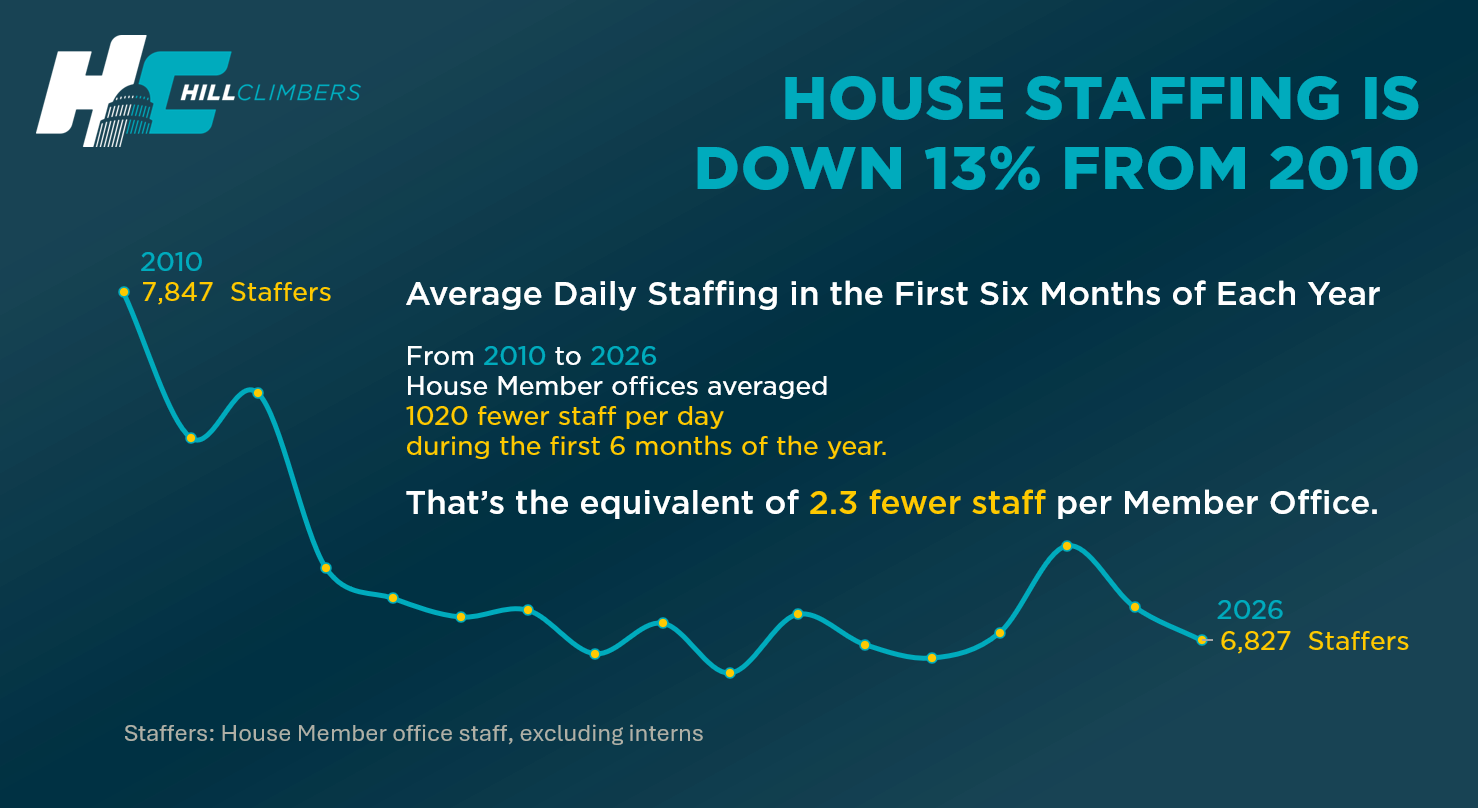
That context changes how the five-team findings should be understood.
These teams are not dividing up a growing workforce.
They are dividing work inside an institution with substantially less non-intern staffing capacity than it had at the beginning of the series and less than it had just two years ago.
Smaller House-Wide Staffing Also Shows Up Inside Individual Offices
The contraction is visible at the office level too.
Our long-term analysis of congressional office size found that most House offices clustered around 16 to 17 staff from 2016 through 2018.
Beginning in 2019, the center of the distribution shifted toward 15 to 16 staff.
Teams remained compressed over the next several years before beginning to grow again after funding increases starting in 2023.
A one-person difference can sound small.
Inside a Member office, it is not.
One fewer employee does not mean one category of work disappears.
Casework still arrives.
The Member still needs a schedule.
Policy portfolios still need coverage.
District relationships still need attention.
Reporters still call.
Constituents still contact the office.
Financial, technical, administrative, and compliance work still has to happen.
When there are fewer people, the work has to be redistributed.
Four of Five Non-Leader Teams Fall Below the House-Wide Pay Benchmark
The salary series showed just how differently compensation is distributed across the office.
At the full-team level:
- District: $85,148
- Legislative: $83,481
- Communications: $82,495
- Constituent Services: $68,546
- Administrative: $67,568
All House Staff excluding interns averaged $82,006.
But each full-team number includes the functional leader.
Removing those positions gives us a more consistent view of the staff working below them.
Four of Five Non-Leader Teams Fall Below the House-Wide Pay Benchmark
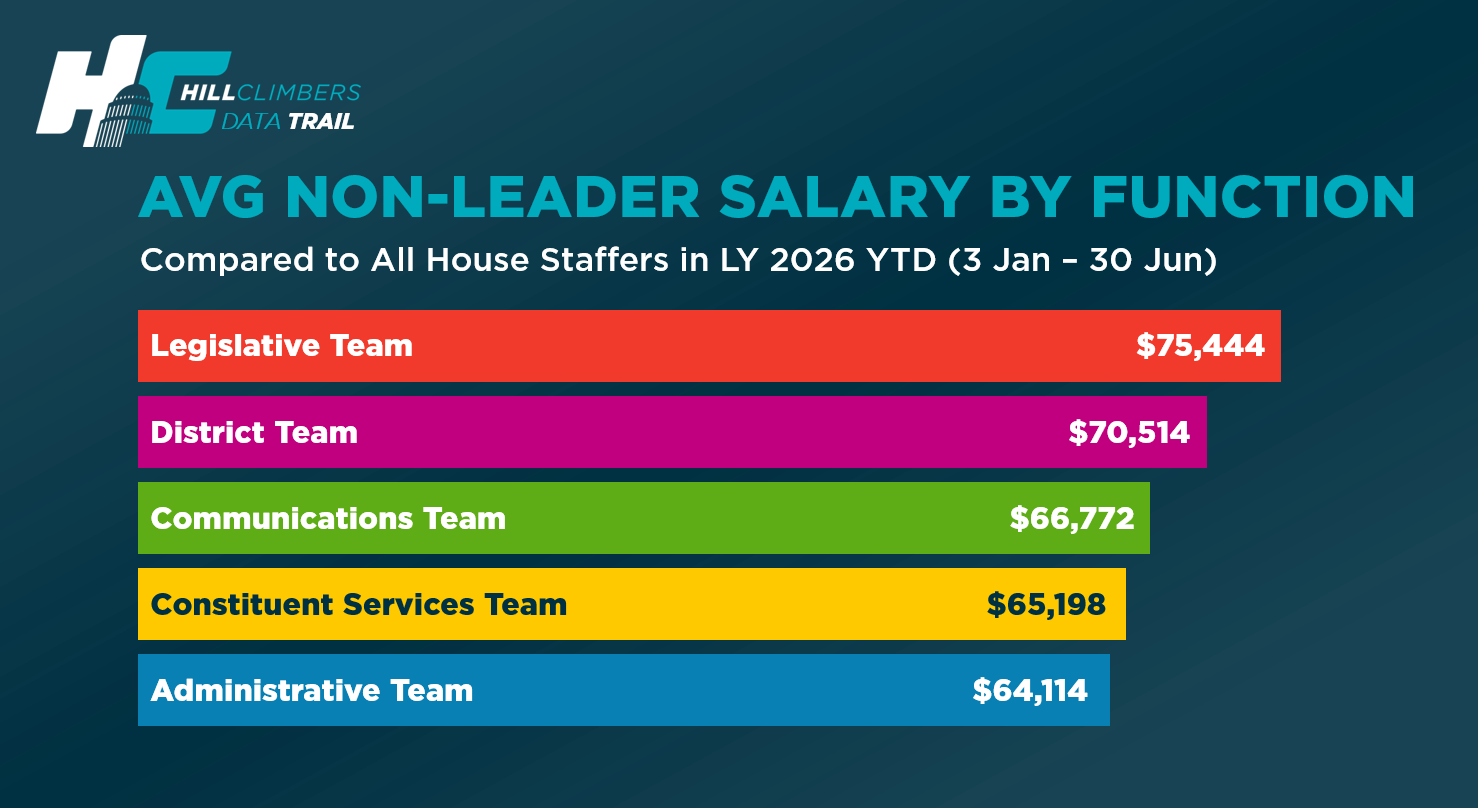
The common non-leader benchmark is $71,824.
Only legislative staff exceed it.
Legislative: $75,444, 5.0% above.
District: $70,514, 1.8% below.
Communications: $66,772, 7.0% below.
Constituent Services: $65,198, 9.2% below.
Administrative: $64,114, 10.7% below.
The point is not that every function should receive the same salary.
The jobs are different.
Their experience profiles are different.
Their career ladders are different.
Their outside labor markets are different.
But the salary structure tells us where compensation pressure is concentrated.
Lower Pay Does Not Necessarily Mean Less Experience
The role data makes that especially clear.
The average CSR/Caseworker has 4.4 years of House experience, even though constituent services sits near the bottom of the pay structure.
Executive Assistants and Office Managers average 5.1 years while working inside the lowest-paid major function.
Specialized Administrative Staff average 8.3 years.
Directors of Constituent Services/Casework also average 8.3 years.
District Directors average 6.7 years.
Deputy District Directors average 6.4 years.
Legislative Directors average 6.0 years.
Compensation is not simply paying for someone's work today.
It is also supporting knowledge accumulated over years.
Experience Is Not Distributed Evenly Across Roles
The new experience comparison makes that pattern visible.
2026 Average House Experience by Role
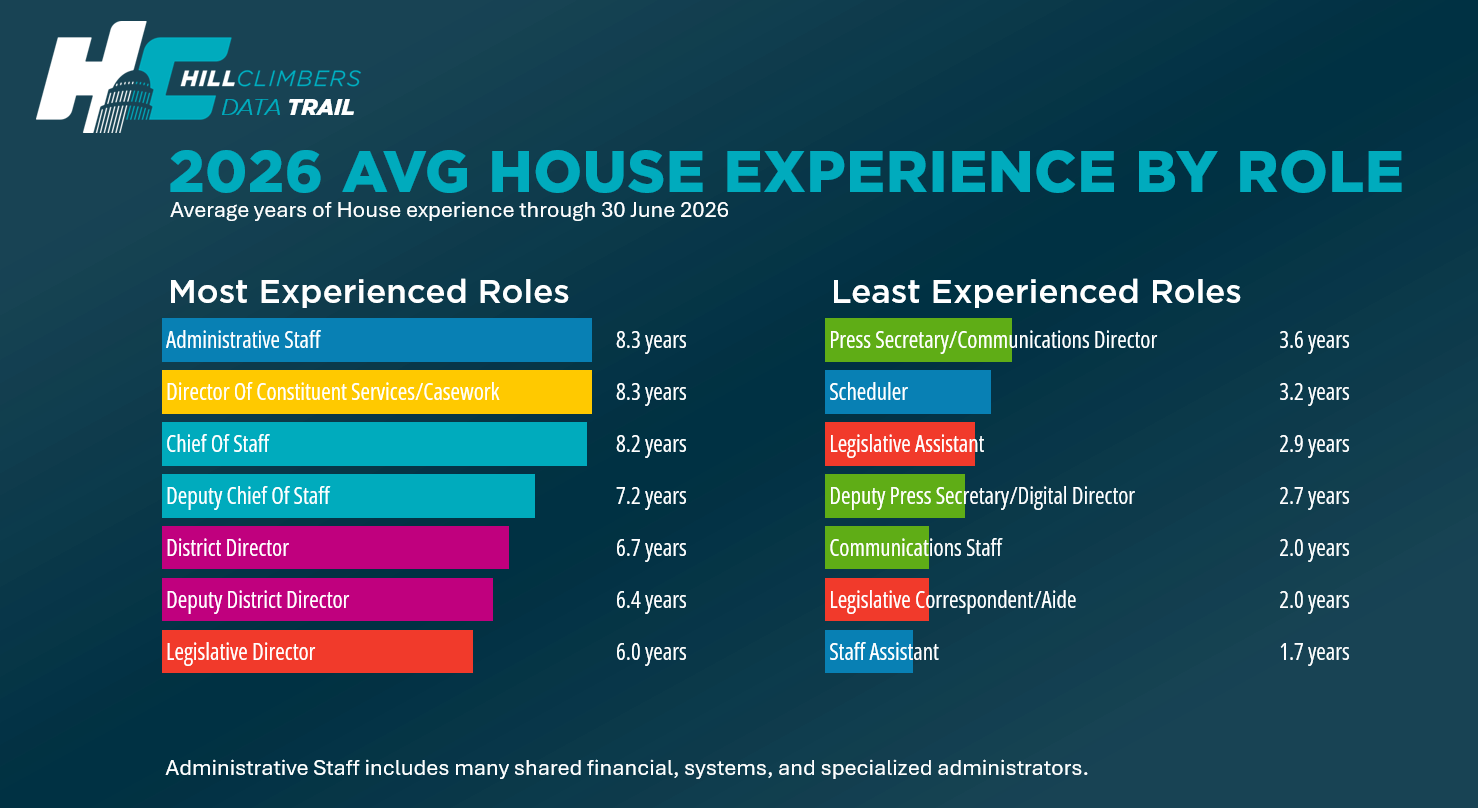
The most experienced roles are spread across the office.
Administrative Staff and Directors of Constituent Services/Casework both average 8.3 years of House experience.
Chiefs of Staff average 8.2 years.
Deputy Chiefs average 7.2.
District Directors average 6.7.
Deputy District Directors average 6.4.
Legislative Directors average 6.0.
The least-experienced side looks very different.
Staff Assistants average 1.7 years.
Legislative Correspondents/Aides and Communications Staff average 2.0 years.
Deputy Press Secretary/Digital Directors average 2.7.
Legislative Assistants average 2.9.
Schedulers average 3.2.
And Press Secretary/Communications Directors average 3.6 years.
That last number matters.
The entire communications ladder sits among the seven least-experienced roles.
Communications is not simply younger at the bottom. Even its functional leaders sit among the House roles with the least average congressional experience.
That makes the communications workforce structurally different from district, constituent services leadership, legislative leadership, and office leadership.
Institutional Knowledge Is Increasingly a Staff Asset
The experience story also fits a broader institutional trend.
Our analysis of rising staff experience as Member tenure declines found that staff increasingly appear to carry an important share of congressional continuity.
The role data shows where some of that knowledge sits.
A caseworker learns agency systems and escalation paths.
A District Director accumulates local relationships.
A Legislative Director builds policy and procedural expertise.
A Chief of Staff learns how an office functions across political and institutional cycles.
A financial or systems administrator develops expertise that can take years to acquire.
That experience does not disappear from the workload when a person leaves.
It has to be rebuilt or transferred.
A vacancy is not fully replaced when the person leaving takes six or eight years of congressional knowledge with them.
Role Turnover Shows a Very Different Pattern by Function
Experience is only one half of the workforce story.
The other is movement.
2026 Midyear Role Turnover Rates

Several early-career roles were already moving quickly by midyear.
Communications Staff: 42.4%
Staff Assistants: 39.5%
Deputy Press Secretary/Digital Directors: 31.7%
Legislative Assistants: 30.5%
Legislative Correspondents/Aides: 30.3%
But those percentages are not House departure rates.
A Legislative Assistant promoted to Senior Legislative Assistant has turned over from the LA role.
A Staff Assistant who becomes an LC has turned over from Staff Assistant.
Someone leaving Congress entirely also counts.
Someone moving to another Member office while remaining in the same classified role does not.
So the question is not simply how many employees are leaving Congress.
It is how quickly people are moving out of particular jobs.
Turnover Clusters by Team
The strongest new turnover finding is not one individual percentage.
It is the functional clustering.
All three communications roles appear among the seven highest comparable midyear role-turnover rates:
Communications Staff: 42.4%
Deputy Press Secretary/Digital Director: 31.7%
Press Secretary/Communications Director: 26.9%
District and constituent services show the opposite pattern.
Every role in both functions falls among the seven lowest comparable rates.
District:
District Director: 7.4%
Deputy District Director: 16.6%
Field Representative: 18.0%
Constituent Services:
Director of Constituent Services/Casework: 8.9%
CSR/Caseworker: 14.5%
Manager of Constituent Services/Casework: 15.6%
Chief of Staff, at 11.8%, is the only role among the seven lowest that belongs to neither function.
Every communications role sits in the high-turnover group. Every district and constituent services role sits in the low-turnover group.
That does not mean district or constituent services employees remain in the same office.
And it does not mean communications staff are necessarily leaving Congress.
It means the occupational ladders operate differently.
Communications is much more fluid.
District and constituent services show considerably less movement out of their classified roles at the Q2 checkpoint.
Communications Stands Out on Both Turnover and Experience
That pattern becomes even more important when Graph 3 and Graph 5 are read together.
All three communications roles are among the seven highest-turnover roles.
All three are also among the seven least-experienced roles.
Press Secretary/Communications Director:
3.6 years of House experience
26.9% midyear role turnover
Deputy Press Secretary/Digital Director:
2.7 years
31.7% turnover
Communications Staff:
2.0 years
42.4% turnover
And among Communications Staff, 31.7% carry multiple roles.
This is happening inside one of the few Member office functions that has clearly expanded over time.
Our earlier analysis of communications staffing growth found roughly 45% growth from 2016 to 2025.
Congress has devoted more staffing capacity to communications.
But the workforce supporting that growth remains comparatively young and highly fluid.
That does not prove the function is unhealthy.
Rapid advancement may account for some of the movement.
Outside opportunities may account for some.
But it does mean a growing and increasingly important part of the Member office has to absorb frequent role changes while rebuilding experience continually.
District Looks Almost Like the Mirror Image
District operates differently.
All three district roles fall among the seven lowest-turnover roles.
And district leadership sits among the most experienced roles in the office.
District Directors average:
6.7 years of House experience
with just 7.4% midyear role turnover.
Deputy District Directors average:
6.4 years
with 16.6% turnover.
Field Representatives average:
3.7 years
with 18.0% turnover.
District staff also lead the full-team salary comparison at $85,148.
Below the District Director level, however, average pay falls to $70,514, slightly below the House-wide non-leader benchmark.
The district story is therefore not simply higher pay.
It is a workforce with a deeply experienced leadership layer and comparatively low movement out of district roles.
That matters because district knowledge is relational.
Staff learn communities.
Local governments.
Civic organizations.
Employers.
Federal facilities.
Stakeholders.
And the history of the Member's relationships throughout the district.
That expertise is difficult to reproduce quickly.
Constituent Services Combines Experience With Lower Role Movement
Constituent services shows a similar turnover pattern.
All three roles fall among the seven lowest-turnover positions.
The Director of Constituent Services/Casework averages 8.3 years of House experience, placing the role at the very top of the experience comparison.
CSR/Caseworkers average 4.4 years.
And nearly one in five, 19.7%, carries multiple roles.
Yet non-leader constituent services pay averages just $65,198, 9.2% below the all-non-leader benchmark.
The role-turnover rates through June were:
Director: 8.9%
CSR/Caseworker: 14.5%
Manager: 15.6%
The workforce therefore combines comparatively low role movement with substantial accumulated knowledge.
That matters because federal casework depends on experience.
Staff learn agency systems.
Documentation requirements.
Escalation channels.
Recurring problems.
And how to help constituents navigate federal bureaucracy when normal processes break down.
The constituent services challenge is not identical to communications.
It appears to be much more about supporting an experienced frontline workforce that remains comparatively stable within its roles despite relatively low compensation.
Legislative Staff Have Stronger Pay but a Fast-Moving Career Ladder
Legislative staff lead non-leader compensation at $75,444.
But movement through the ladder is substantial.
Legislative Directors average 6.0 years of House experience, with 23.2% midyear role turnover.
Senior Legislative Assistants average 5.0 years, with 24.4% turnover.
Legislative Assistants average 2.9 years, with 30.5% turnover.
Legislative Correspondents/Aides average 2.0 years, with 30.3% turnover.
And 26.4% of Legislative Correspondents/Aides carry multiple roles.
The legislative challenge is therefore less about being at the bottom of the internal salary structure.
It is about sustaining the career ladder that develops experienced policy staff.
Congress needs movement through that ladder.
But it also needs enough people to remain in Congress long enough to become the six-year Legislative Directors the institution later relies on.
Administrative Staff Show a Different Kind of Pressure
Administrative staff sit at the bottom of both salary comparisons.
The full team averages $67,568.
Below the Director of Operations level, the average is $64,114.
But the administrative team is not one kind of workforce.
Staff Assistants average 1.7 years of experience.
Their midyear role turnover had already reached 39.5%, and 24.3% carry multiple roles.
Schedulers average 3.2 years, with 39.5% carrying multiple roles.
Executive Assistants/Office Managers average 5.1 years, and 42.9% carry multiple roles.
Directors of Operations average 4.5 years, with 25.0% carrying multiple roles.
And specialized Administrative Staff average 8.3 years, with 44.9% shared among offices.
Administrative pressure therefore looks less like one single turnover pattern.
It looks like responsibility being distributed across people who frequently carry several functions.
Multiple Hats Cluster Where Office Functions Meet
That pattern is visible across the office.
Multiple-Role Staffing Is Concentrated in Key Bridge and Support Jobs
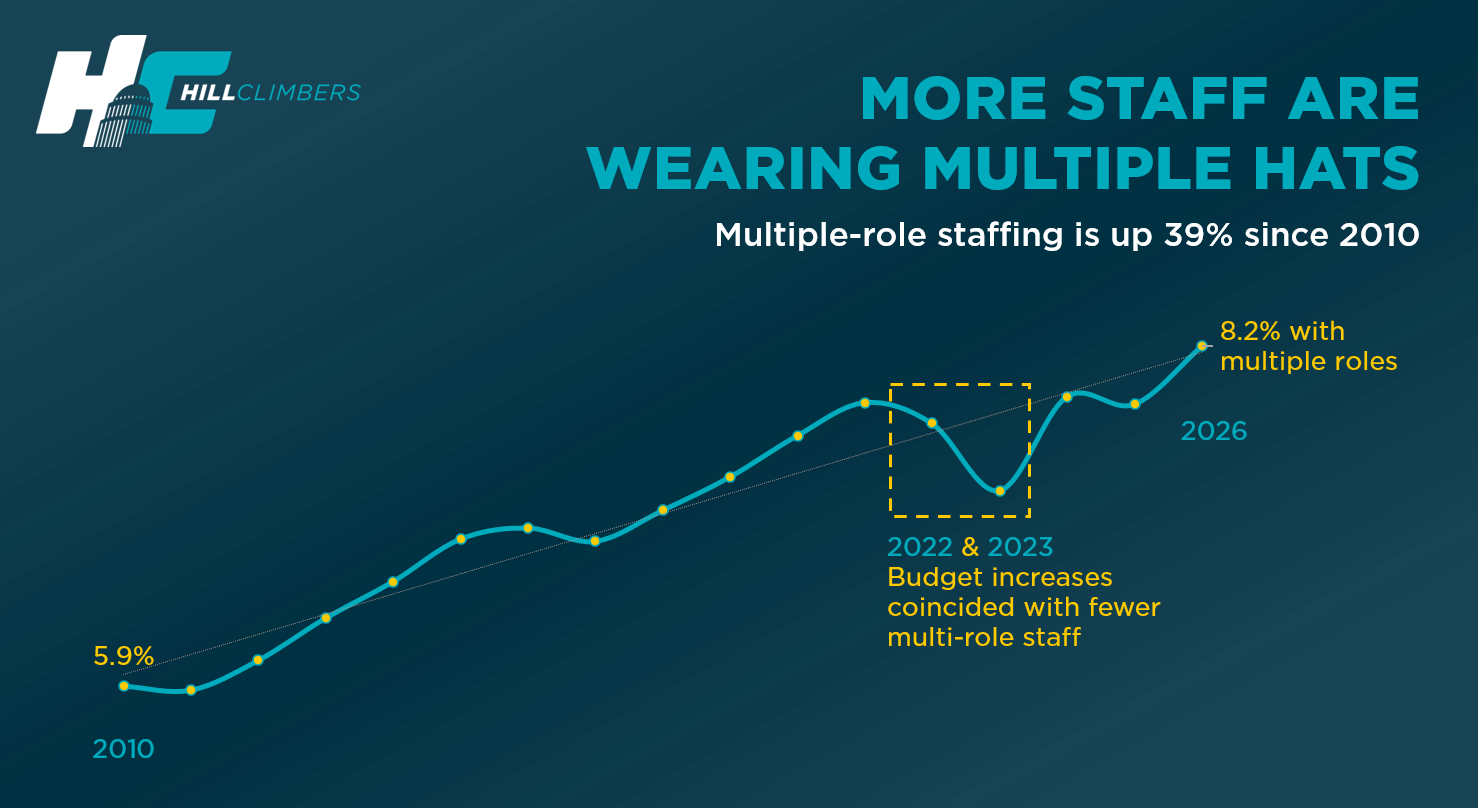
The highest shares include:
Executive Assistant/Office Manager: 42.9%
Deputy Chief of Staff: 41.6%
Scheduler: 39.5%
Communications Staff: 31.7%
Legislative Correspondent/Aide: 26.4%
Director of Operations: 25.0%
Staff Assistant: 24.3%
CSR/Caseworker: 19.7%
Field Representative: 16.6%
These are not random positions.
Many sit at the seams of the office.
A Staff Assistant may also handle legislative correspondence, communications support, constituent intake, or scheduling.
A Scheduler may also be an Executive Assistant.
A Communications Staffer may help with district, legislative, or front-office work.
A caseworker may also serve as a Field Representative.
A Deputy Chief may oversee an entire functional portfolio in addition to office management.
Multiple-role staffing can be useful.
Congressional offices are small organizations.
Some combinations are practical and intentional.
But the broader rise in staff wearing multiple hats also suggests offices increasingly have less room to separate responsibilities into dedicated positions.
Headcount Alone Cannot Show How Work Is Distributed
Imagine two offices with the same number of employees.
One has a dedicated Scheduler, Staff Assistant, Legislative Correspondent, Communications Staffer, Field Representative, and Caseworker.
Another combines several of those responsibilities among fewer job titles.
The headcount can look identical.
The organizational capacity is not.
That is why the Q2 staffing methodology distinguishes between the office view and the role view.
For House-wide workforce measures, one person counts once.
For role analysis, a title such as "Deputy Chief of Staff and Communications Director" can legitimately appear in both role categories.
The office view tells us how many people Congress has.
The role view tells us how the work is distributed among those people.
The House Has Also Changed What Kind of Workforce It Uses
The workforce is not only smaller.
Its composition has changed.
Our analysis of congressional institutional memory and workforce composition found that interns had become the second-largest workforce group and represented nearly one-fifth of House staffing capacity.
Internships play an important role.
They provide educational opportunities.
They can expand access to Capitol Hill.
They also give offices flexibility.
But interns operate differently from longer-duration staff positions.
They rotate frequently.
Offices repeatedly recruit, onboard, train, and transfer knowledge to new cohorts.
At the same time, our analysis of the shrinking entry-level staff pipeline found a roughly 16% decline in traditional Staff Assistant, Legislative Correspondent, and Legislative Aide staffing from 2016 to 2025.
That does not prove interns directly replaced those jobs.
But it does show that the workforce structure changed.
Congress is relying more heavily on internships while several traditional junior staff pathways have narrowed.
Career Pipelines Matter Because Congress Develops Expertise Internally
A Chief of Staff averaging 8.2 years of House experience did not arrive with eight years of House experience.
Neither did an 8.3-year Director of Constituent Services.
Or a 6.7-year District Director.
Or a 6.0-year Legislative Director.
Congress develops much of that expertise internally.
Employees enter junior positions.
They learn the institution.
They move into more complex roles.
They build policy expertise, procedural familiarity, agency knowledge, local relationships, and office-specific judgment.
That progression is part of congressional infrastructure.
The challenge is not eliminating turnover.
The challenge is maintaining enough of the ladder that people can move through Congress, rather than simply through it and out.
Office Leadership Has to Coordinate All of These Pressures
Above the functional teams sits the office leadership layer.
Chiefs of Staff average 8.2 years of House experience.
Their midyear role-turnover rate was just 11.8%, and only 0.6% hold multiple roles.
Deputy Chiefs look very different.
They average 7.2 years of experience.
But 41.6% carry multiple roles, and midyear role turnover had already reached 25.2%.
The Deputy Chief is one of the clearest bridge roles in the office.
That makes sense.
Somebody has to coordinate all of these competing needs.
Should the next hire go to casework or communications?
Should a vacancy be filled or existing employees receive raises?
Does the office need another Field Representative?
Another Legislative Assistant?
A dedicated Scheduler?
Can two jobs reasonably be combined?
Could shared expertise cover a specialized administrative need?
Those decisions all come back to the same resource constraint.
Flat Budgets Turn Every Workforce Problem Into a Tradeoff
Member offices fund salaries and operations from one constrained allowance.
Payroll competes with district operations, travel, technology, official communications, supplies, rent, and other expenses.
Our Q1 analysis of Member office spending found that average office spending fell 11.5% from 2025 Q1 to 2026 Q1.
Personnel spending fell 3.3%.
Non-personnel spending fell 30.3%.
Offices appear to have cut much more deeply around payroll.
But personnel spending still fell.
That is the common constraint behind the five very different team stories.
Flat budgets do not produce flat outcomes. They force offices to decide which capacity they can afford to lose.
Where Should the House Consider Investing Next?
The combined data does not suggest one universal staffing model.
It suggests offices need enough room to make better workforce choices.
Give Offices More Real Budget Capacity
The broadest need is flexibility.
An office cannot indefinitely protect salaries, preserve headcount, maintain district operations, add expertise, and absorb rising operating costs if its real purchasing power is shrinking.
Additional resources do not tell an office what to hire.
They let the office decide.
Examine the Functions Where Pay Lags Most
Administrative staff average 10.7% below the all-non-leader benchmark.
Constituent services are 9.2% below.
Communications are 7.0% below.
Those differences do not prove any individual salary is inadequate.
They identify where compensation pressure is concentrated.
Treat Different Turnover Patterns Differently
Communications does not look like constituent services.
District does not look like legislative.
All three communications roles are comparatively fluid.
District and constituent services show much lower movement out of their roles.
Legislative has a clear progression through a fast-moving ladder.
Administrative pressure is heavily tied to role overlap.
There is no single retention strategy that fits every team.
Protect the Career Pipeline
Today's Staff Assistants, Legislative Correspondents, Communications Staff, Field Representatives, Caseworkers, and Legislative Assistants are the people from whom tomorrow's senior workforce may emerge.
Shrinking the bottom of the ladder while expecting experienced staff to remain available at the top is difficult to sustain.
Give Offices More Room to Specialize
Multiple roles are not inherently bad.
But there is a difference between intentionally combining related jobs and combining them because there is no room to hire separately.
Additional capacity gives offices that choice.
Use Shared Expertise Where It Makes Sense
The Administrative Staff model shows that some highly experienced specialists can serve multiple offices.
That may work well for financial, systems, technical, and other specialized functions.
It will not work for everything.
Casework relationships, district knowledge, Member-specific communications, and many policy responsibilities need to remain embedded in the office.
The opportunity is not to centralize everything.
It is to identify where shared infrastructure can release resources for work that cannot be shared.
The Goal Is Not More Headcount for Its Own Sake
The 13% staffing decline matters.
But congressional capacity is not simply a contest to restore an old headcount.
A stronger workforce might mean:
better compensation,
more employees,
more specialization,
fewer vacancies,
stronger career progression,
greater retention of experienced staff,
or more shared specialist capacity.
Different offices will choose differently.
That is also why the HillClimbers Index looks beyond raw headcount when evaluating workforce capacity.
A Member office is not just a Member.
It is a team.
And the strength of that team depends not simply on how many people are employed, but on whether the office has enough experience, specialization, continuity, compensation, and resources to do the work Congress asks of it.
What the Data Does and Does Not Tell Us
This report covers the 2026 Q2 checkpoint through June 30.
It is not a final full-year 2026 result.
Salary, staffing, experience, and role-turnover measures can change during the second half of the year.
Role turnover measures movement out of a classified role.
It can include promotion, movement into another House role, or departure from Congress.
A staffer who changes Member offices while remaining in the same classified role does not count as role turnover.
That is why the communications, district, and constituent services turnover patterns should be interpreted as differences in movement out of roles, not as office-level retention rates.
House-wide staffing uses an office-view, person-level method.
Each staffer counts once.
Role analysis preserves a primary role and, where the title clearly reflects it, a secondary role.
The Statements of Disbursements also do not provide a universal field identifying whether every employee is permanent or non-permanent.
Titles explicitly identifying interns, part-time employees, temporary employees, or similar statuses can be classified accordingly.
Other titles should not automatically be labeled permanent.
Administrative Staff require an additional caution.
Many are shared across offices.
Adding or dropping an office assignment can therefore create apparent role-office movement even when the employee continues doing essentially the same work.
For that reason, the raw Administrative Staff turnover figure is not used as a conventional turnover measure in this report.
The 2026 Picture Is Bigger Than Pay
This project started by asking what each House team earns.
It ended up telling us much more about how the modern Member office works.
The House is operating with 1,020 fewer non-intern staff per day than it did in 2010.
Its recent staffing rebound has begun to unwind.
Many individual offices have spent much of the past several years operating with smaller teams.
Interns make up a much larger part of staffing capacity while several traditional junior pathways have narrowed.
Four of five major non-leader teams fall below the House-wide non-leader salary benchmark.
Experience is concentrated differently across functions.
All three communications roles are among both the least-experienced and highest-turnover roles.
Every district and constituent services role sits among the lower-turnover group.
Administrative work is frequently spread across people carrying more than one responsibility.
Legislative staff have stronger internal pay but a fast-moving career ladder.
And office leadership has to reconcile all of those differences inside the same constrained budget.
That is the broader 2026 workforce story.
Congressional capacity is staff capacity. The question is not simply how many staff the House can afford. It is whether Member offices have enough resources to pay, specialize, develop, and retain the workforce they already depend on.
FAQ
How many House Member office staff are there in 2026?
House Member offices averaged 6,827 non-intern staff per day from January 3 through June 30, 2026. This is a Q2 checkpoint, not the final 2026 staffing average. HillClimbers
How much has House staffing declined since 2010?
Average daily non-intern staffing declined from 7,847 in the first half of 2010 to 6,827 in 2026, a decrease of 1,020 staff or 13.0%. HillClimbers
Did House staffing recently recover?
Yes, partially. Average first-half non-intern staffing reached 7,065 in 2024, the highest comparable level since 2013. It then fell to 6,926 in 2025 and 6,827 in 2026. HillClimbers
What is the average salary for non-leader House staff in 2026?
All non-leader House staff averaged $71,824 through June 30, 2026.
Which House team has the highest non-leader salary?
Legislative staff averaged $75,444, the highest among the five major non-leader functions.
Which House team has the lowest non-leader salary?
Administrative staff averaged $64,114, followed by constituent services at $65,198 and communications at $66,772.
Which roles have the highest first-half role turnover?
Among the comparable roles in this report, Communications Staff had reached 42.4%, Staff Assistants 39.5%, Deputy Press Secretary/Digital Directors 31.7%, Legislative Assistants 30.5%, and Legislative Correspondents/Aides 30.3% by June 30.
Does role turnover mean someone left Congress?
No. Role turnover means an employee stopped holding that classified role. It can include promotion, movement into another House role, or departure from Congress. An employee who changes offices while remaining in the same classified role does not count as role turnover.
Which roles are most likely to carry multiple roles?
Executive Assistants/Office Managers had a 42.9% multiple-role share, Deputy Chiefs of Staff 41.6%, Schedulers 39.5%, and Communications Staff 31.7%.
Which roles have the most House experience?
Among the roles examined here, Administrative Staff average 8.3 years, Chiefs of Staff 8.2, Deputy Chiefs 7.2, District Directors 6.7, Deputy District Directors 6.4, and Legislative Directors 6.0.
Are interns becoming a larger part of the House workforce?
Yes. HillClimbers' earlier workforce analysis found interns had become the second-largest workforce group and represented nearly one-fifth of House staffing capacity. HillClimbers
How have typical House office sizes changed?
Most offices clustered around 16 to 17 staff from 2016 through 2018. The center shifted toward 15 to 16 staff beginning in 2019, with teams expanding again after funding increases beginning in 2023. HillClimbers
Does the SOD identify whether every employee is permanent?
No. The Statements of Disbursements do not provide a universal permanent/non-permanent status field. Titles can explicitly identify interns, part-time staff, temporary employees, and similar statuses, but other staff should not automatically be described as permanent.
Why is Administrative Staff turnover excluded from the comparison?
Many Administrative Staff are shared financial, systems, or operational employees serving multiple Member offices. Adding or dropping office assignments can generate apparent turnover in the role-office data even if the person continues doing substantially the same work.
Where does the House workforce appear to face the greatest pressure?
The data suggests several different pressure points: lower compensation in administrative, constituent services, and communications roles; rapid movement through junior career-ladder positions; high rates of multiple-role staffing in several bridge and support jobs; declining overall non-intern staffing; and the need to retain experienced employees carrying institutional knowledge.
Where should the House consider investing?
The data suggests the greatest value may come from giving offices enough budget flexibility to improve compensation where needed, sustain career pathways, retain experienced staff, decide when specialization is worth funding, and expand shared specialist capacity where that model works.
Suggested Reading
- The House Is Running With 1,020 Fewer Staff Than It Did in 2010
- The House Staffing Drop Is No Longer Just an Early-Year Dip
- How Big Is a Congressional Office Team and Why It’s Shrinking Again
- Congress May Be Trading Institutional Memory for Workforce Flexibility
- Institutional Knowledge in Congress Is Increasingly Held by Staff
- How Congress Quietly Replaced Part of Its Entry-Level Workforce
- House Offices Are Running Out of Things to Cut
- More House Staff Are Wearing Multiple Hats
- Low-Paying Congressional Offices Experience the Highest Staff Turnover
- The Staff Helping Shape the Nation’s Laws Average $75,444
- The House Staff Constituents Rely On Average $65,198
- The Comms Team Is Growing, but Non-Leader Pay Averages Just $66,772
- District Staff Lead House Pay, but Non-Leaders Average $70,514
- The House’s Lowest-Paid Team Keeps Offices Running. Non-Leaders Average $64,114
Explore Related HillClimbers Tools
- Explore the HillClimbers Index
- Explore Congressional Staffing Data
- Learn How Congressional Staffing Works
- Explore Member Office Roles
- Explore All House Staff Excluding Interns
- Explore All House Staff
- Explore the Congressional Dataset
- Browse HillClimbers Insights
- View Current Congressional Jobs